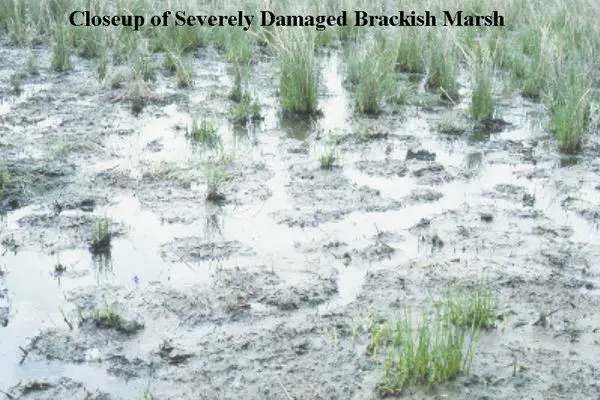
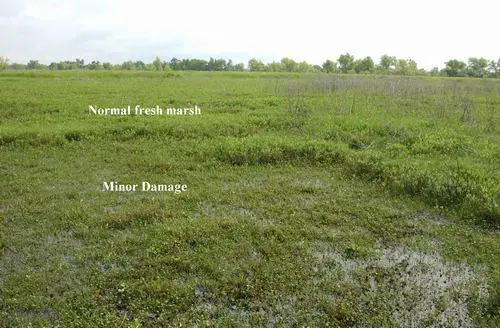
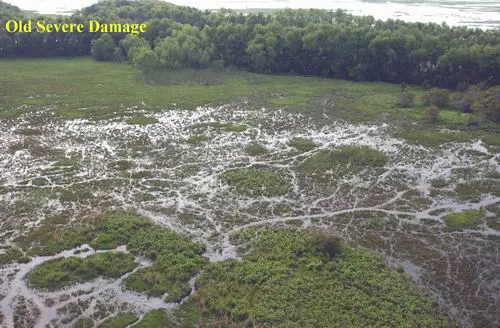
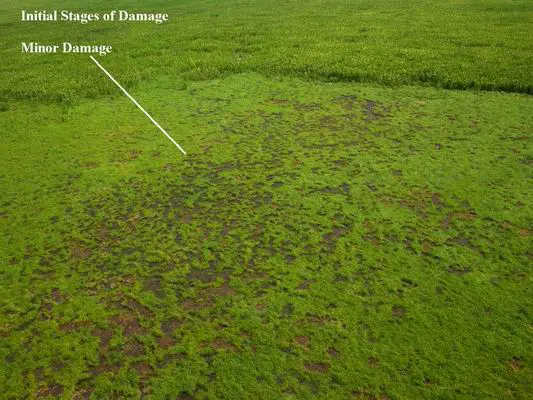
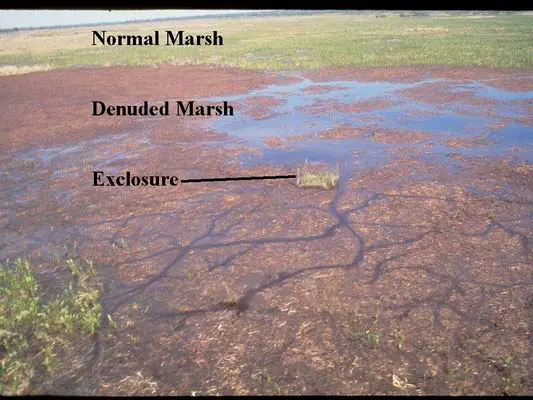
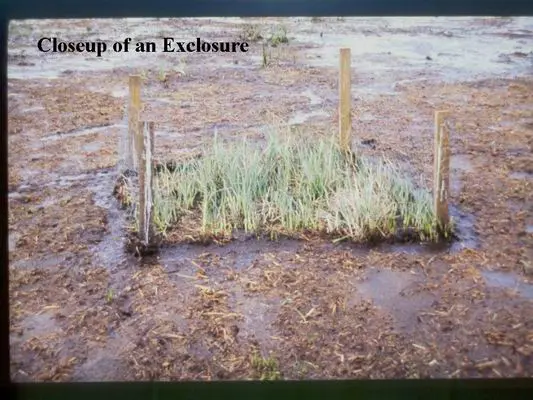
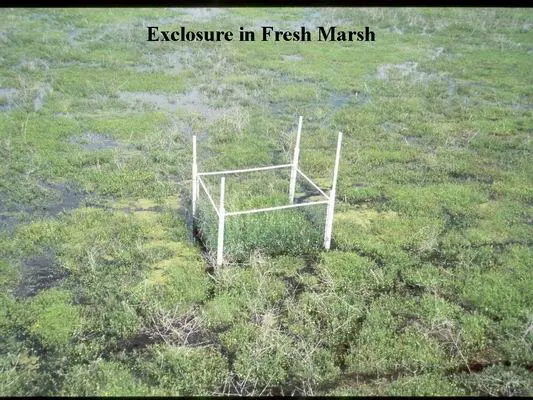
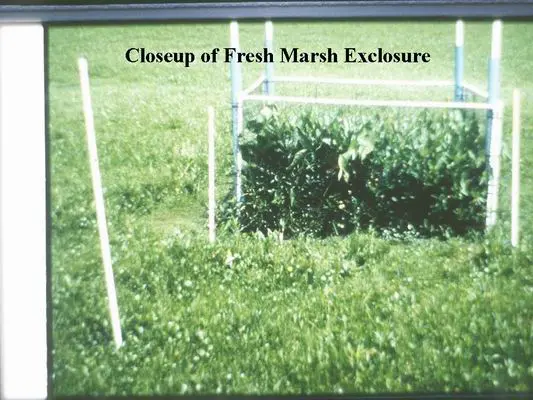
Prior to the Coastwide Nutria Control Program, estimates of vegetative damage caused by nutria encompassed as much as 102,585 acres and was documented in at least 11 Coastal Wetlands Planning Protection and Restoration Act (CWPPRA) project sites in the Barataria-Terrebonne Basins. That estimate of >100,000 acres of marsh damaged was conservative because only the worse (most obvious) damage can be detected from aerial surveys and the number of acres being impacted was certainly higher.
Since the introduction of the Coastwide Nutria Control Program in 2002, the number of impacted acres has dropped as low as 4,181 acres (2014). Overgrazing by nutria removes vegetation from the surface of the marsh, which results in the very fragile organic soils becoming exposed to erosion through tidal action. If damaged areas do not revegetate quickly, they will become open water as tidal scour removes soil and thus lowers elevation. Frequently, nutria grazing damages the plant’s root systems, making recovery through vegetative regeneration very slow. Reduced harvest since the 2015-2016 season resulted in increased nutria damage to 16,424 ac in 2018. Damaged acres decreased by 11% as the 2019 survey estimated 14,652 ac damaged coastwide.
The first coastwide nutria herbivory survey was flown in 1998 and continued through 2001, as part of the Nutria Harvest and Wetland Demonstration Program. The Coastwide Nutria Control Program began in 2002. Below are the total number of nutria damage sites and the number of acres documented for each year.
| Year | Total # oDamaged Sites Observed | Total # Damaged Acres Observed | Estimates # Damaged Acres Coastwide * |
|---|---|---|---|
| 1998 | 170 | 23,960 | 89,850 |
| 1999 | 150 | 27,356 | 102,585 |
| 2000 | 132 | 25.939 | 102,585 |
| 2001 | 124 | 22,139 | 83,021 |
| 2002 | 94 | 21,185 | 79,444 |
| 2003 | 84 | 21,888 | 82,080 |
| 2004 | 69 | 16,906 | 63,398 |
| 2005 | 49 | 14,260 | 53,475 |
| 2006 | 21 | 14,260 | 53,475 |
| 2007 | 23 | 9,244 | 34,665 |
| 2008 | 23 | 6,171 | 23,141 |
| 2009 | 19 | 5,422 | 20,333 |
| 2010 | 11 | 1,679 | 6,296 |
| 2011 | 10 | 2,260 | 8,475 |
| 2012 | 11 | 1,129 | 4,233 |
| 2013 | 12 | 1,266 | 4,624 |
| 2014 | 11 | 1,115 | 4,181 |
| 2015 | 12 | 1,602 | 6,008 |
| 2016 | 11 | 1,732 | 6,496 |
| 2017 | 16 | 1,564 | 5,866 |
| 2018 | 21 | 4,380 | 16,424 |
| 2019 | 25 | 3,907 | 14,652 |
| 2020 | 23 | 3,654 | 13,702 |
| 2021 | 23 | 2,250 | 8,437 |
| 2022 | 22 | 1,248 | 4,682 |
| 2023 | 22 | 1,263 | 4,736 |
| 2024 | 22 | 1,479 | 5,546 |
* Coastwide damage estimated by formula: damaged acres observed x 3.75. The 3.75 multiplication factor comes from the area not visible from the transect lines flown in aerial surveys.
Click on images to see wetland damage caused by nutria.
